By
Jin Kim
February 1, 2024
•
3
min read

We’re excited to launch our new integration with Google Analytics, most widely used tool for study website analytics. Our Google Analytics connector provides biotech companies the ability to analyze their study website and the efficacy of their online recruitment efforts from Miracle’s unified dashboard.
In the Integrations page in Settings, you can now click “Setup Integration” for “Google Analytics”.
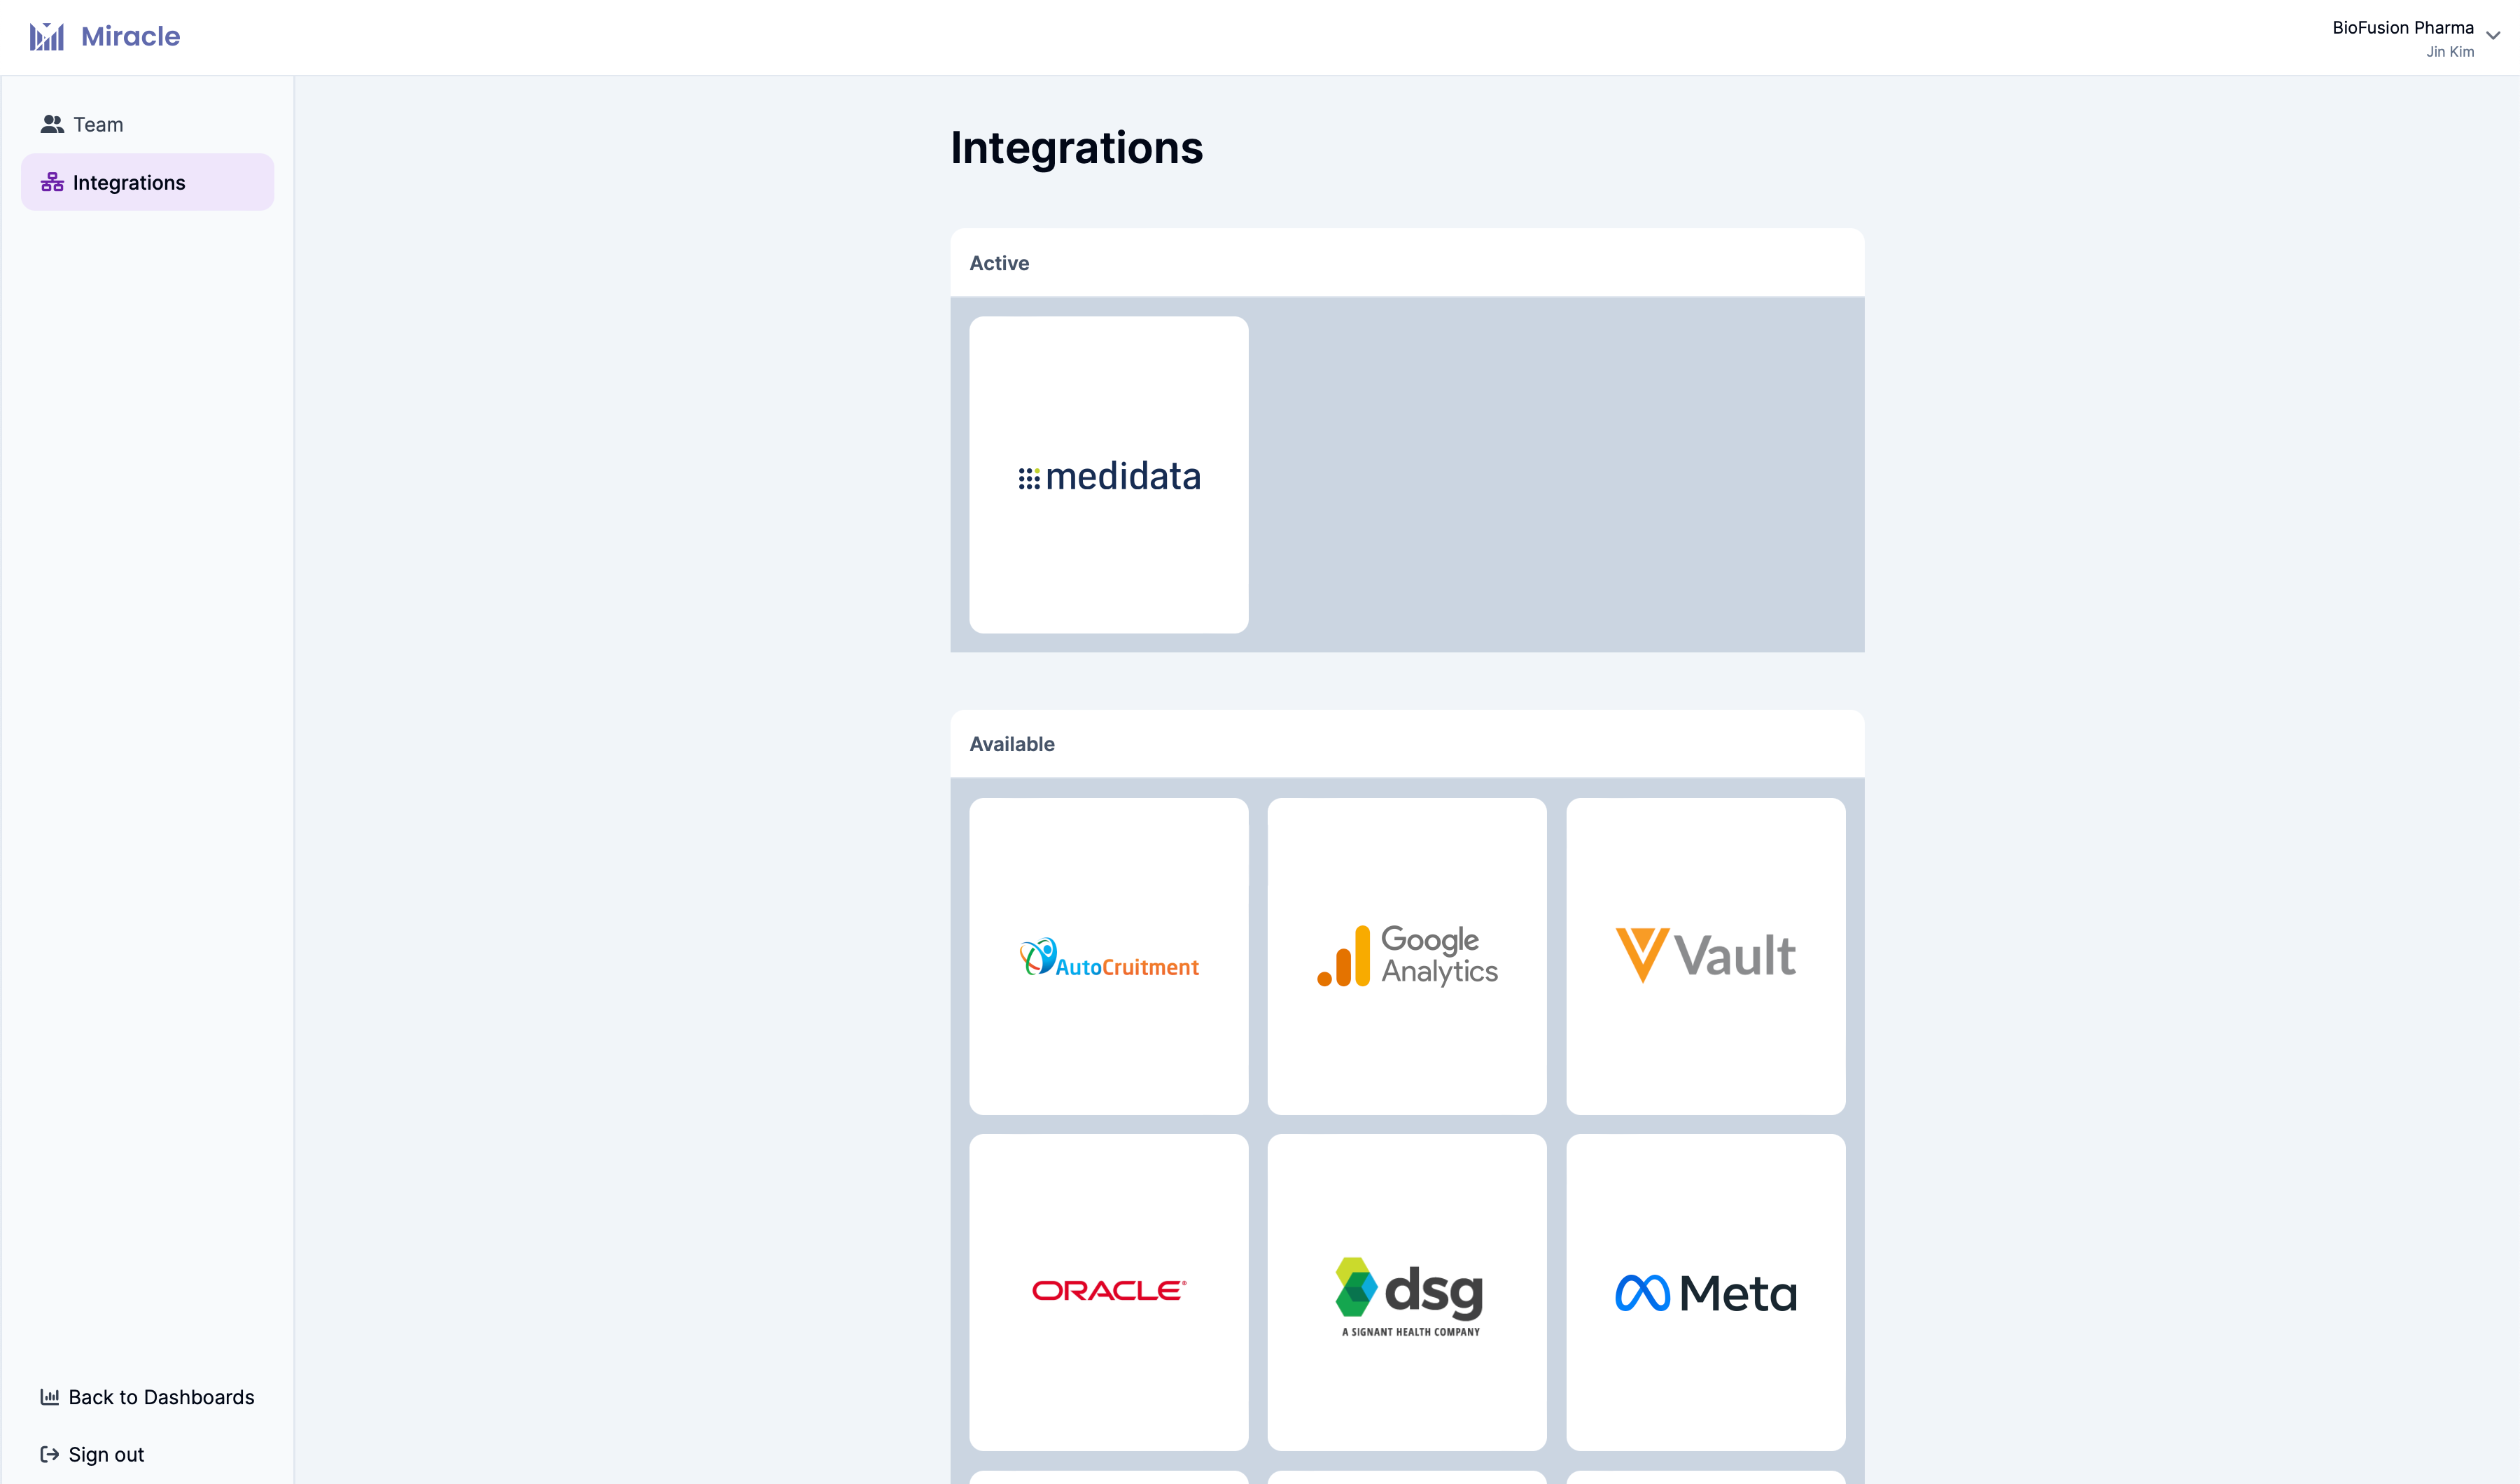
If you’d like to make a request for a particular integration, please reach out and let us know. We have many more integrations on our roadmap, and periodically, we may invite a select few biotech companies into our closed beta of new integrations — if you’d like to be on the waitlist, please leave us a message.
You will be asked to provide Miracle access to your Google Analytics workspace with a Viewer role. Follow the instructions in the setup, and once you have completed this step, the integration will commence.
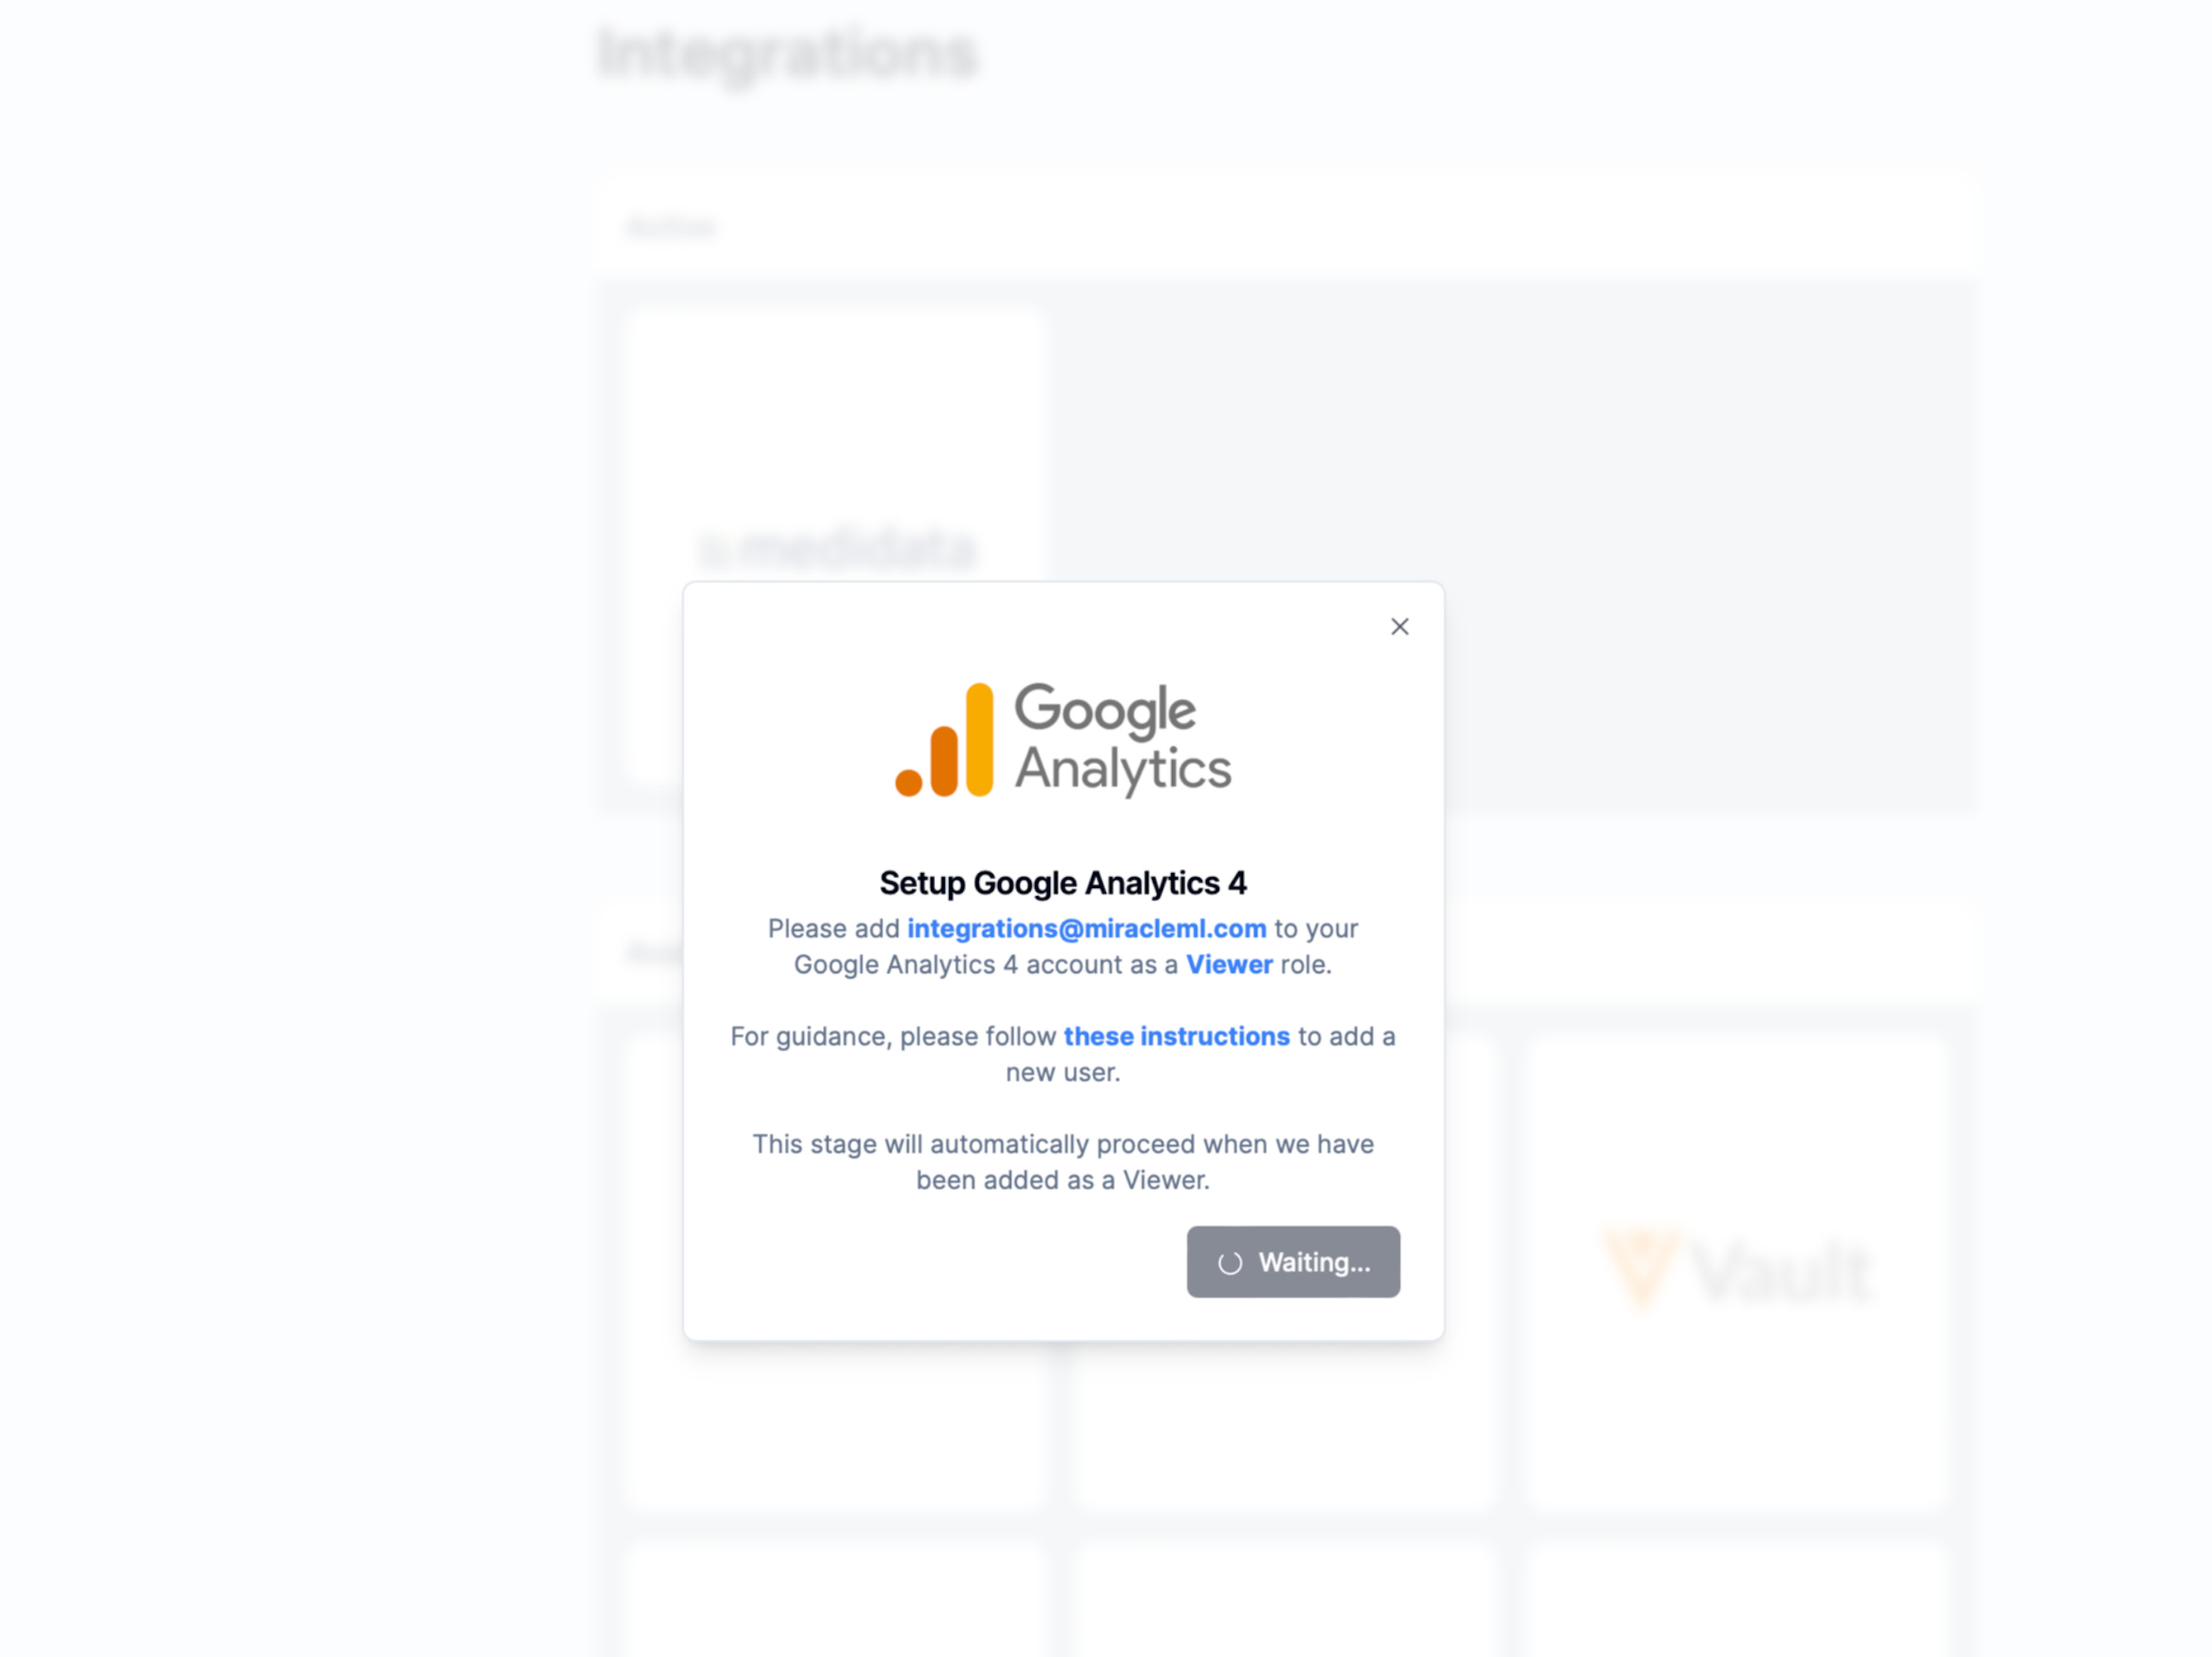
As always, protecting the privacy of sensitive user information remains at the forefront of our priorities as we continue to launch new features. Security is of utmost importance — we are built on HIPAA-compliant infrastructure. We ensure that all data is transmitted under secure network conditions, protected by HTTPS encryption. This means every bit of information sent to and from our system is encrypted, safeguarding against unauthorized access and ensuring the integrity of your sensitive data. Our customers place a high amount of trust in us, and we're committed to exceeding industry standards when it comes to security.
For verification, you will be asked confirm which project in your Google Analytics workspace to integrate into Miracle.
After confirming, Miracle will sync with your Google Analytics instance, map into our data model, and prepare out-of-box dashboards that analyze your study website and online questionnaire prescreener. In the below example, the top visualization in our out-of-box dashboard visualizes a real-time funnel of potential participants visiting a study website, starting the online prescreen questionnaire, passing the questionnaire, and expressing interest to learn more about the study. Other visualizations in the dashboard below help break down traffic over time, number of participants submitting the form over time, what devices people are using, what regions potential participants are in, and from which on-line initiatives people are directed to your study website.
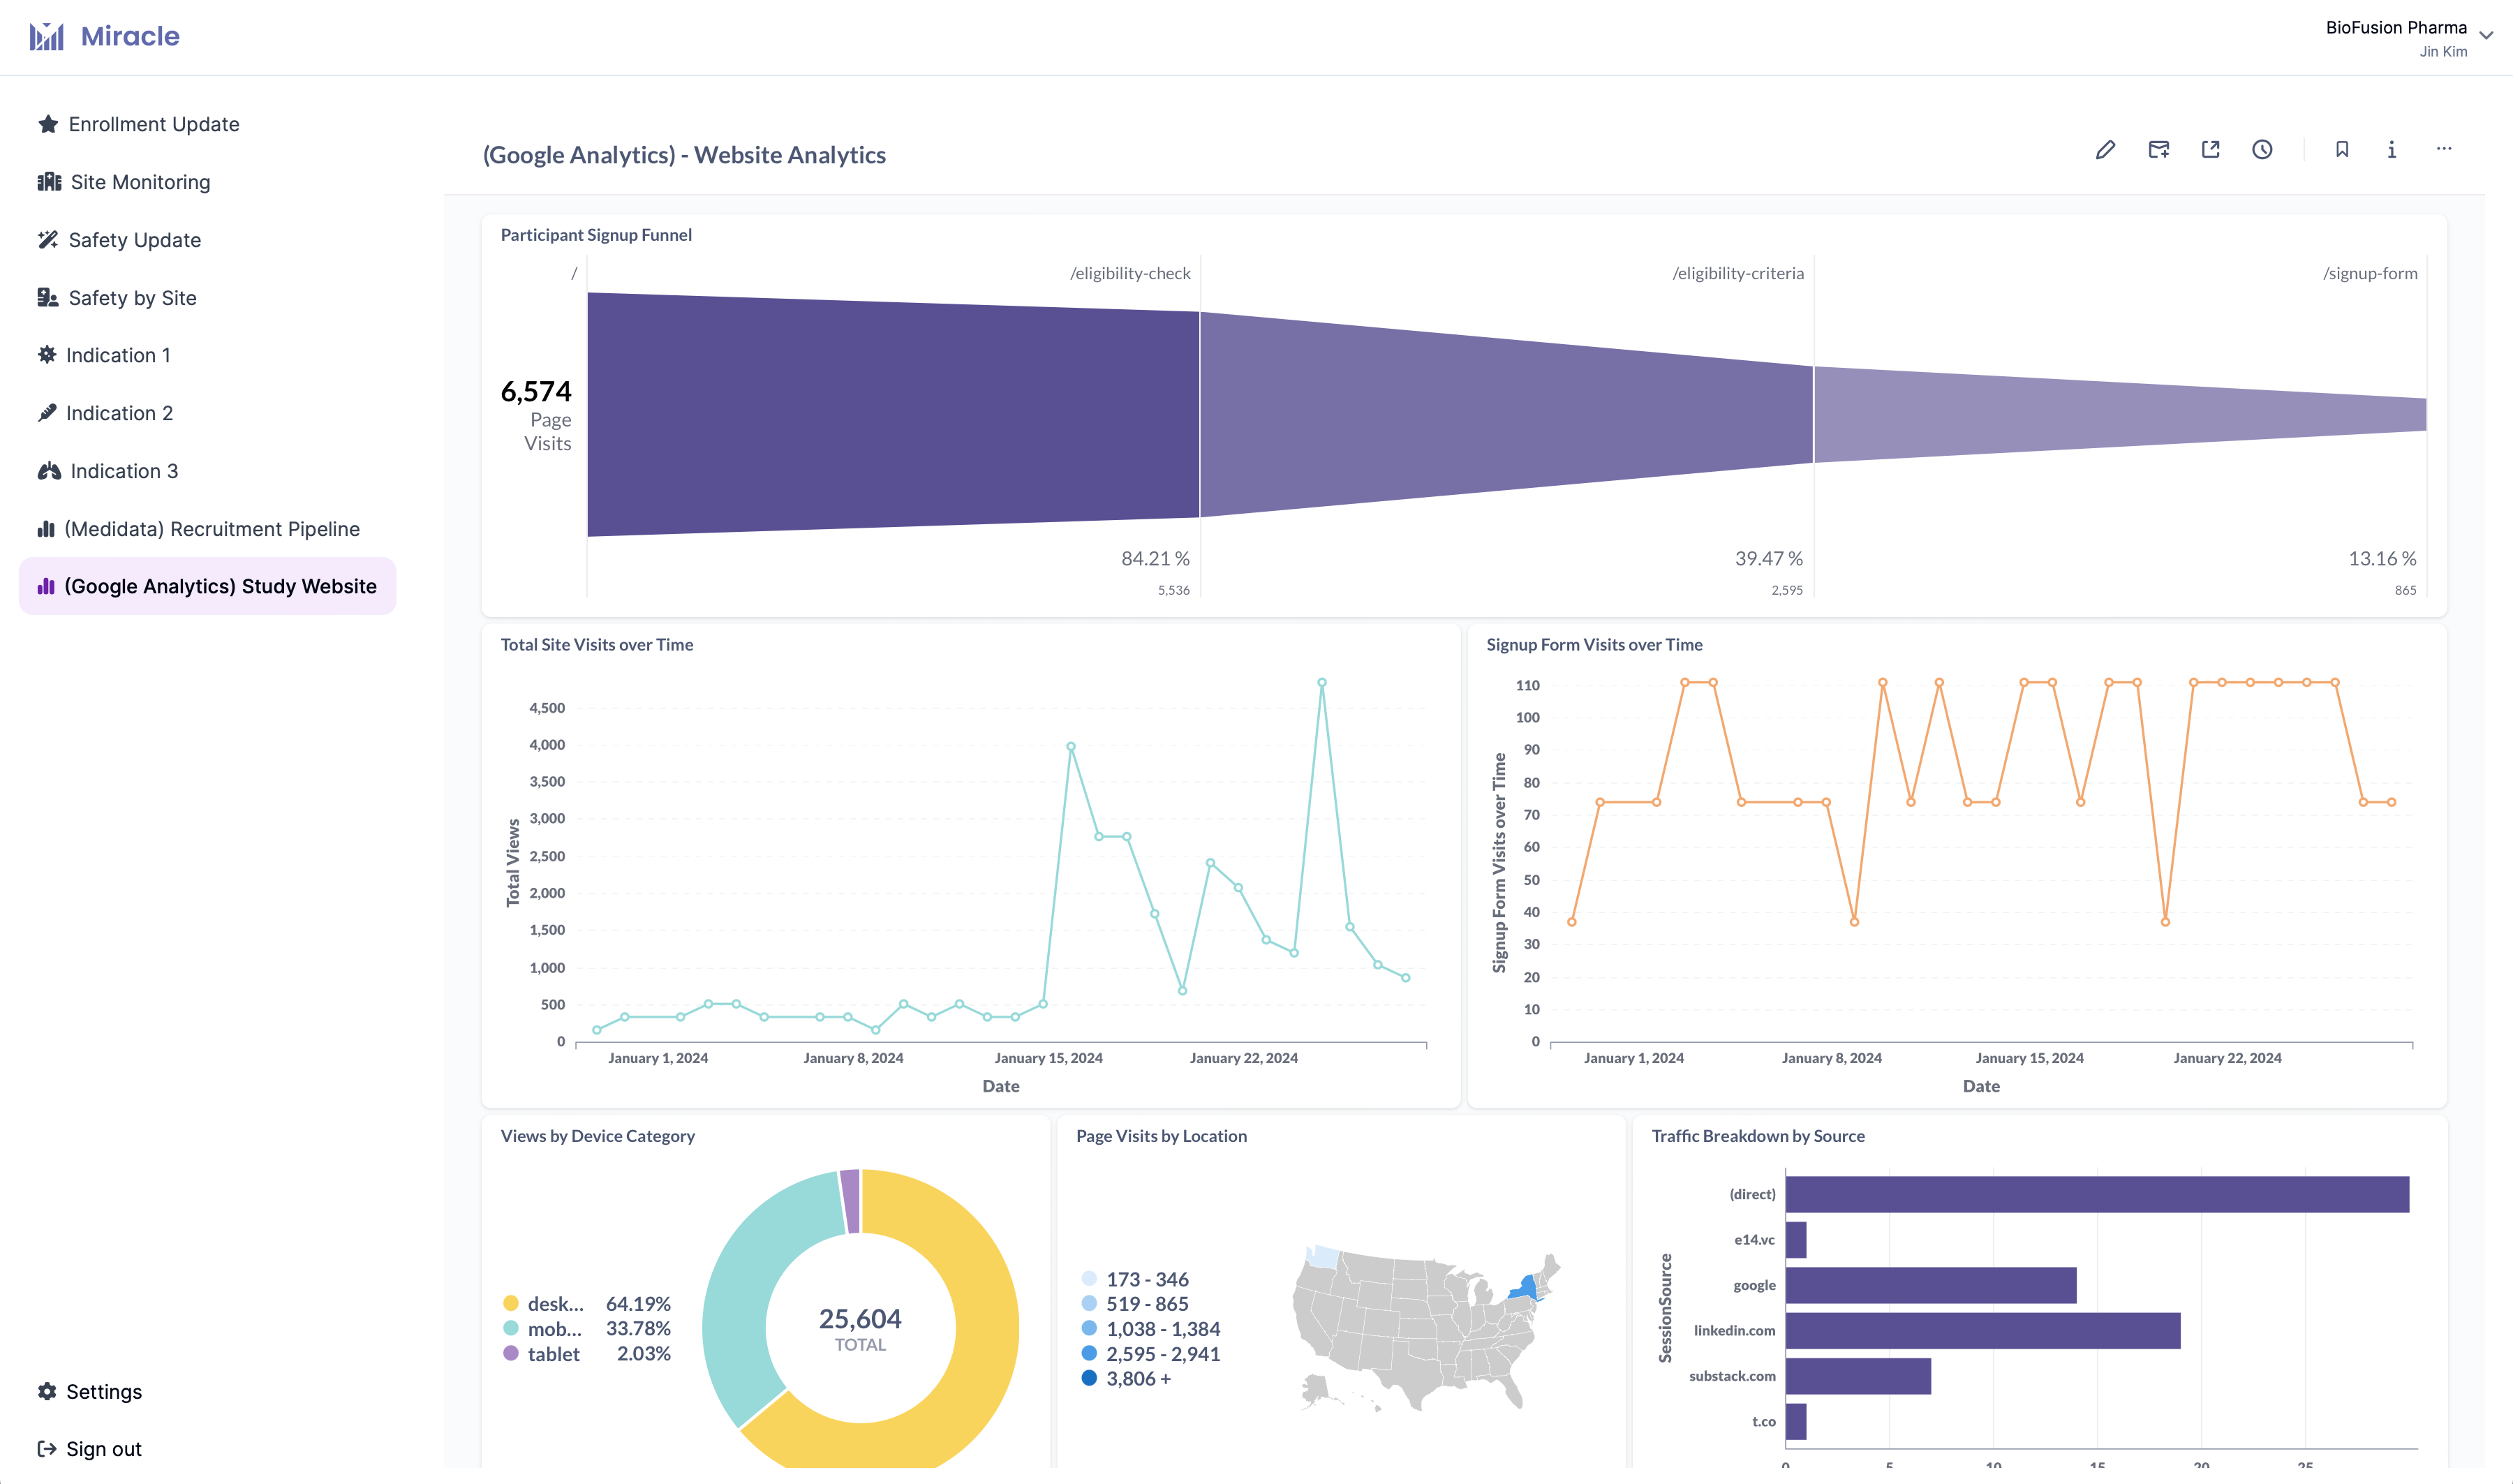
The key insight here is that Miracle provides the flexibility to analyze the inbound traffic to your study website and online prescreen questionnaire using Miracle. You can drill into visualizations for granular details into various acquisition channels, number of potential participants passing or failing your online questionnaire over time, spin up new dashboards with our user-friendly UI, and answer new questions that come up over the course of your trial.
Most importantly, you can clearly break down which acquisition channels (i.e. Facebook ads, Google ads, your recruitment vendors, social media agencies) are yielding effective rates of randomizations for your study, so that you can focus on the most effective drivers of recruitment to speed up your trial — saving both time and money.
Please reach out to get started with Miracle or provide any feedback!

Say goodbye to tedious spreadsheet trackers and finish trials ahead of schedule.


