By
Jin Kim
April 16, 2026
•
5
min read
.png)
In clinical trials, ensuring the right drug supply is available at the right site, at the right time, is far more complex than simple inventory tracking. It often requires tight coordination between Clinical Operations (ClinOps) and Chemistry, Manufacturing, and Controls (CMC) teams, two groups that often operate with different systems, data sources, and priorities.
At the heart of this challenge lies a deceptively simple question: Do we have the right number of kits at each site to support upcoming patient visits without overstocking and risking waste?
ClinOps teams are responsible for patient activity: tracking enrollment, randomization, and visit schedules, typically through EDC systems. Meanwhile, CMC teams manage drug supply logistics through RTSM/IRT systems and depot inventories.
These systems rarely communicate seamlessly.
As a result, reconciling supply and demand becomes a manual, error-prone process:
Without integration, this often leads to one common workaround: spreadsheets.
In many biotech companies, teams export data from multiple systems and attempt to reconcile it manually:
This process is not just time-consuming, but also it’s inherently fragile. Small discrepancies in timing or the person responsible for trackers being out of office can lead to significant downstream issues.
There are several ways to optimize drug supply inventory at sites.
Sites with a high number of upcoming visits must have adequate kits available. This requires:
Failure here risks missed doses, protocol deviations, and compromised study integrity.
Conversely, sites with few or no upcoming visits often accumulate excess inventory. Over time, this leads to:
To mitigate imbalance, teams may need to:
But these decisions depend on accurate, real-time visibility across both supply and demand.
A key complexity in reconciliation is that upcoming visits at sites need to have projected visit windows and also accommodate out of window visits as necessary.
Teams must anticipate:
This often involves building visit forecasts from:
Without automation, these projections are manually constructed and difficult to maintain as studies evolve.
The core issue is the lack of connectivity between systems that forces teams to track this information in trackers manually.
But without a unified view, teams are forced to bridge the gap themselves.
This leads to:
To move beyond manual reconciliation, organizations need a more cohesive strategy:
Bringing together EDC, RTSM/IRT, and depot data into a single source of truth enables real-time visibility into both supply and demand.
Leveraging patient-level data to dynamically project upcoming visits reduces reliance on static assumptions and manual tracking.
With integrated data, teams can:
A shared view allows ClinOps and CMC teams to operate from the same playbook—improving collaboration and reducing friction.
At Miracle, we’ve been working closely with clinical teams to address this exact challenge by unifying fragmented data and making it actionable.
By integrating directly with EDC systems, we enable teams to visualize patient activity in a forward-looking way: surfacing upcoming visit windows based on protocol-defined schedules of assessments, including minimum and maximum visit days. This allows ClinOps and CMC teams to move beyond static snapshots and understand when demand will occur, not just what has already happened.
In parallel, we aggregate drug supply data across RTSM/IRT and depot systems to provide real-time visibility into inventory levels at the site and country level. This includes the flexibility to account for different protocol versions, ensuring that supply and demand are aligned even as studies evolve.
The real impact comes from connecting these datasets. With a unified view, Miracle enables proactive alerts that flag potential risks ahead of time. Whether it’s an impending stockout at a high-enrolling site or excess inventory at a low-activity site that may expire. Instead of relying on manual reconciliation in Excel, teams can take timely, data-driven actions to rebalance supply, reduce waste, and maintain study continuity.
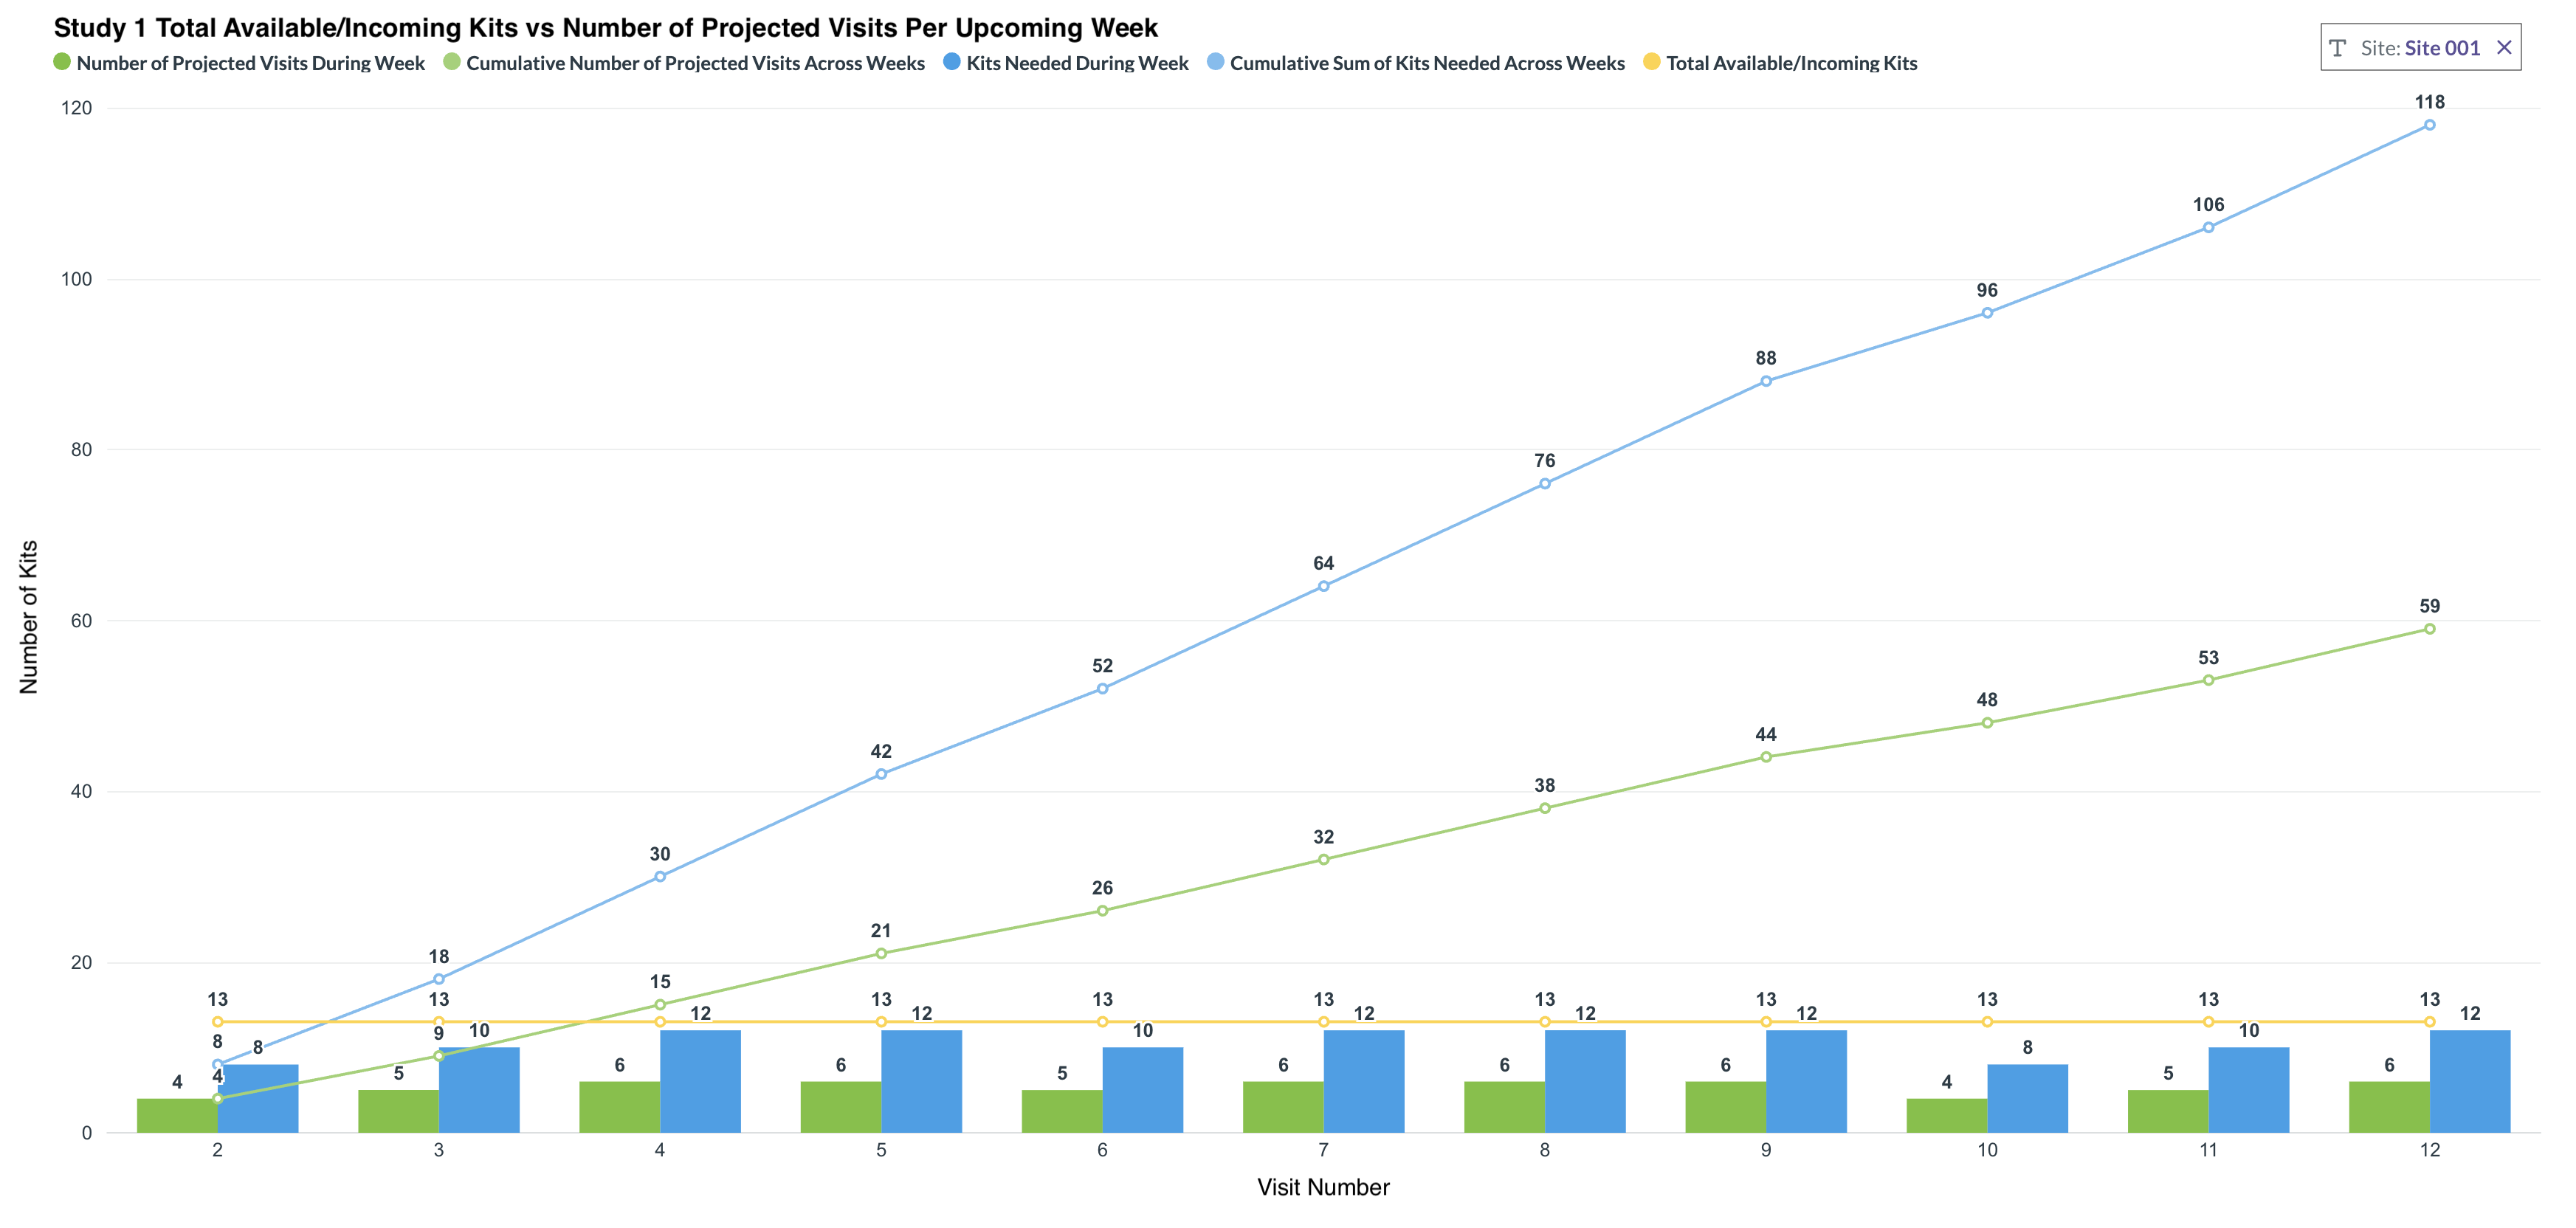
Another capability that has proven especially valuable is the ability to visualize cumulative visit demand alongside drug supply projections over configurable time horizons. Shorter-term views help teams make informed ordering and resupply decisions, while longer-term projections support budgeting and forecasting at both the study and country level.
This also ties into how many teams operationalize site strategies. Within site trackers, sites are often categorized based on expected enrollment behavior, such as high-supply or low-supply strategies. By layering projected visit demand against actual supply and enrollment trends, teams can validate whether sites are tracking against expectations, identify deviations early, and adjust allocation strategies accordingly. This creates a feedback loop between planning assumptions and real-world performance, improving both supply efficiency and financial predictability.
Reconciling clinical trial drug supply can be viewed as a data integration challenge that currently requires teams to use manual trackers to bridge systems together.
As trials grow more complex and timelines tighten, relying on manual Excel-based workflows is increasingly unsustainable. By connecting patient activity with supply data and introducing forward-looking projections, organizations can move from reactive firefighting to proactive optimization.
The result: fewer stockouts, less waste, and a more efficient path to delivering therapies to patients.

Say goodbye to tedious spreadsheet trackers and finish trials ahead of schedule.

.png)
.png)
.png)
.png)
.png)
.png)

.png)